NDPE / DCF
Your suppliers ranked for NDPE/DCF risk, every month
Compare your deforestation, peat clearance and exploitation risk performance against your peers.
Free early access for companies that produce, buy, trade, or invest in palm oil and derivatives.
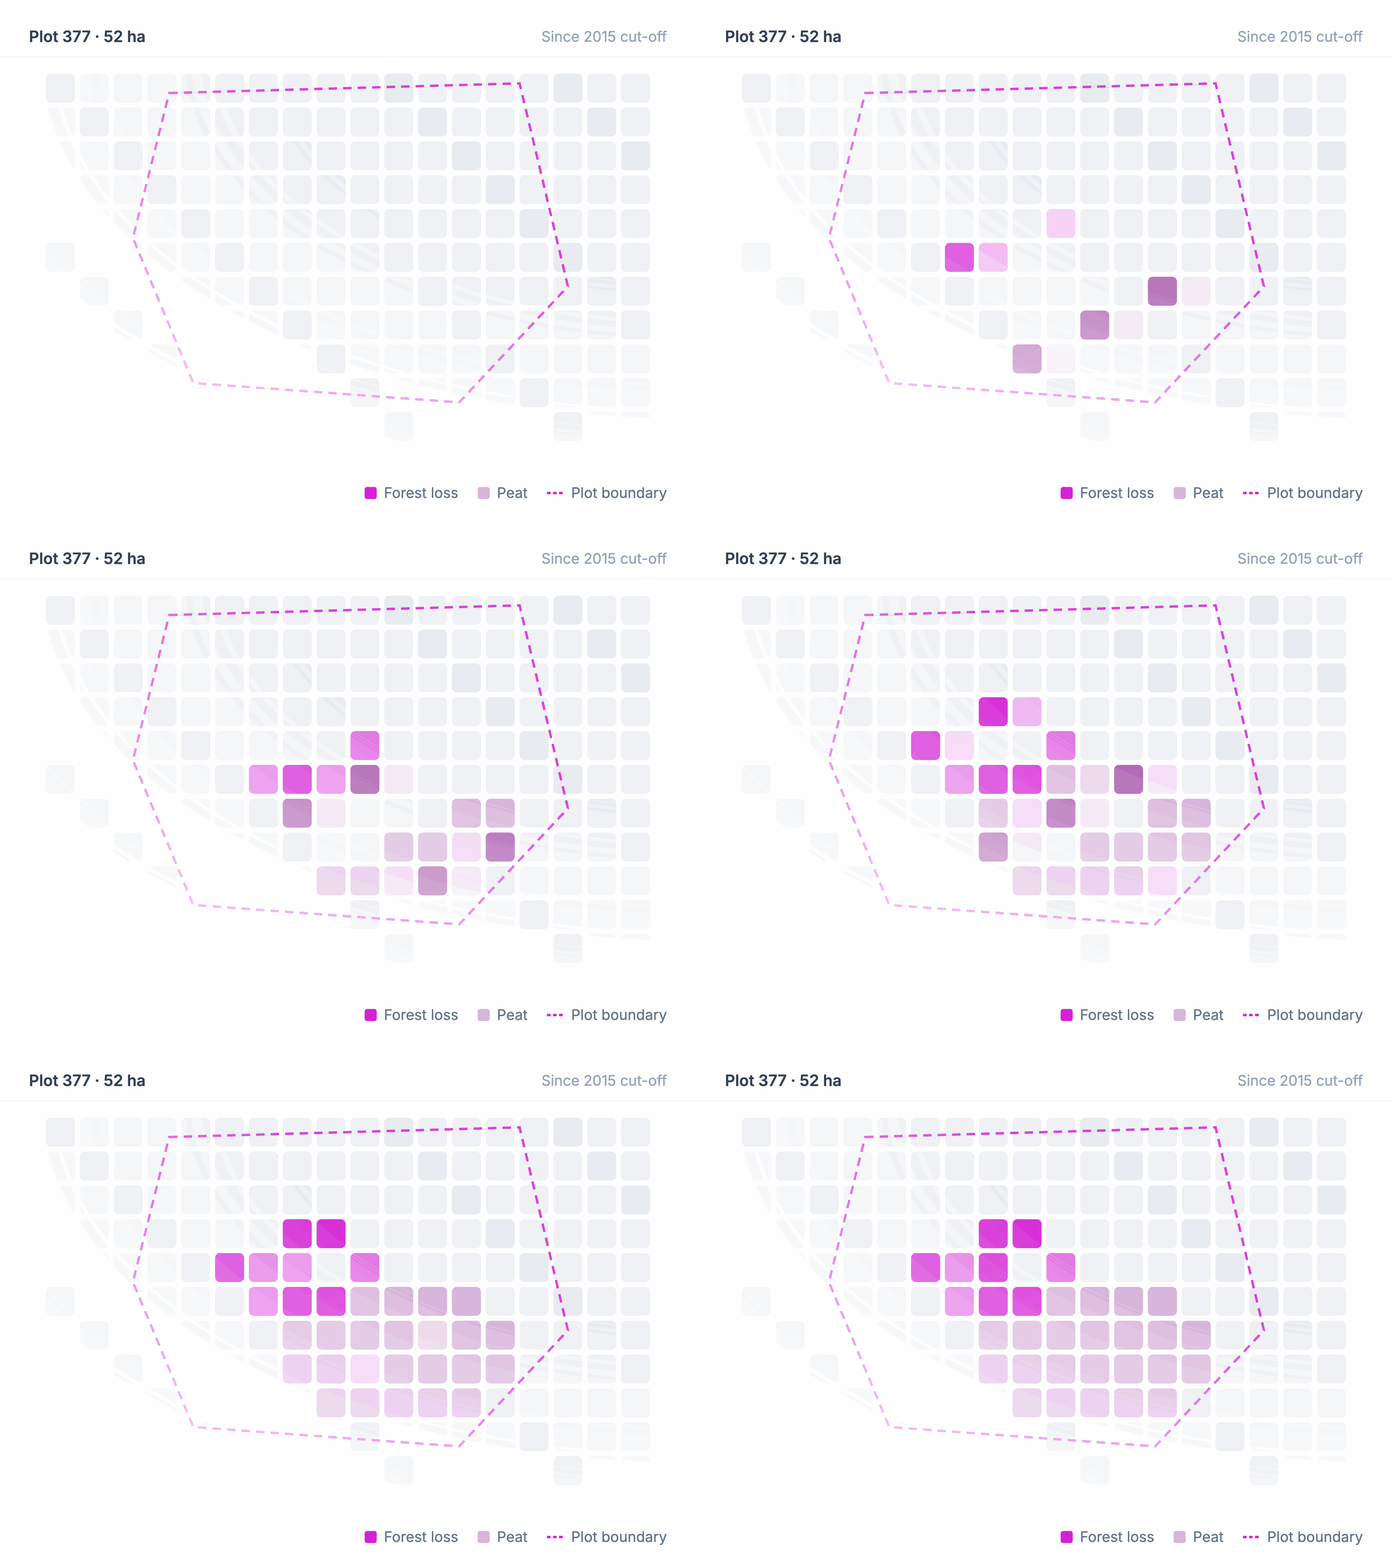


Your NDPE/DCF dashboard
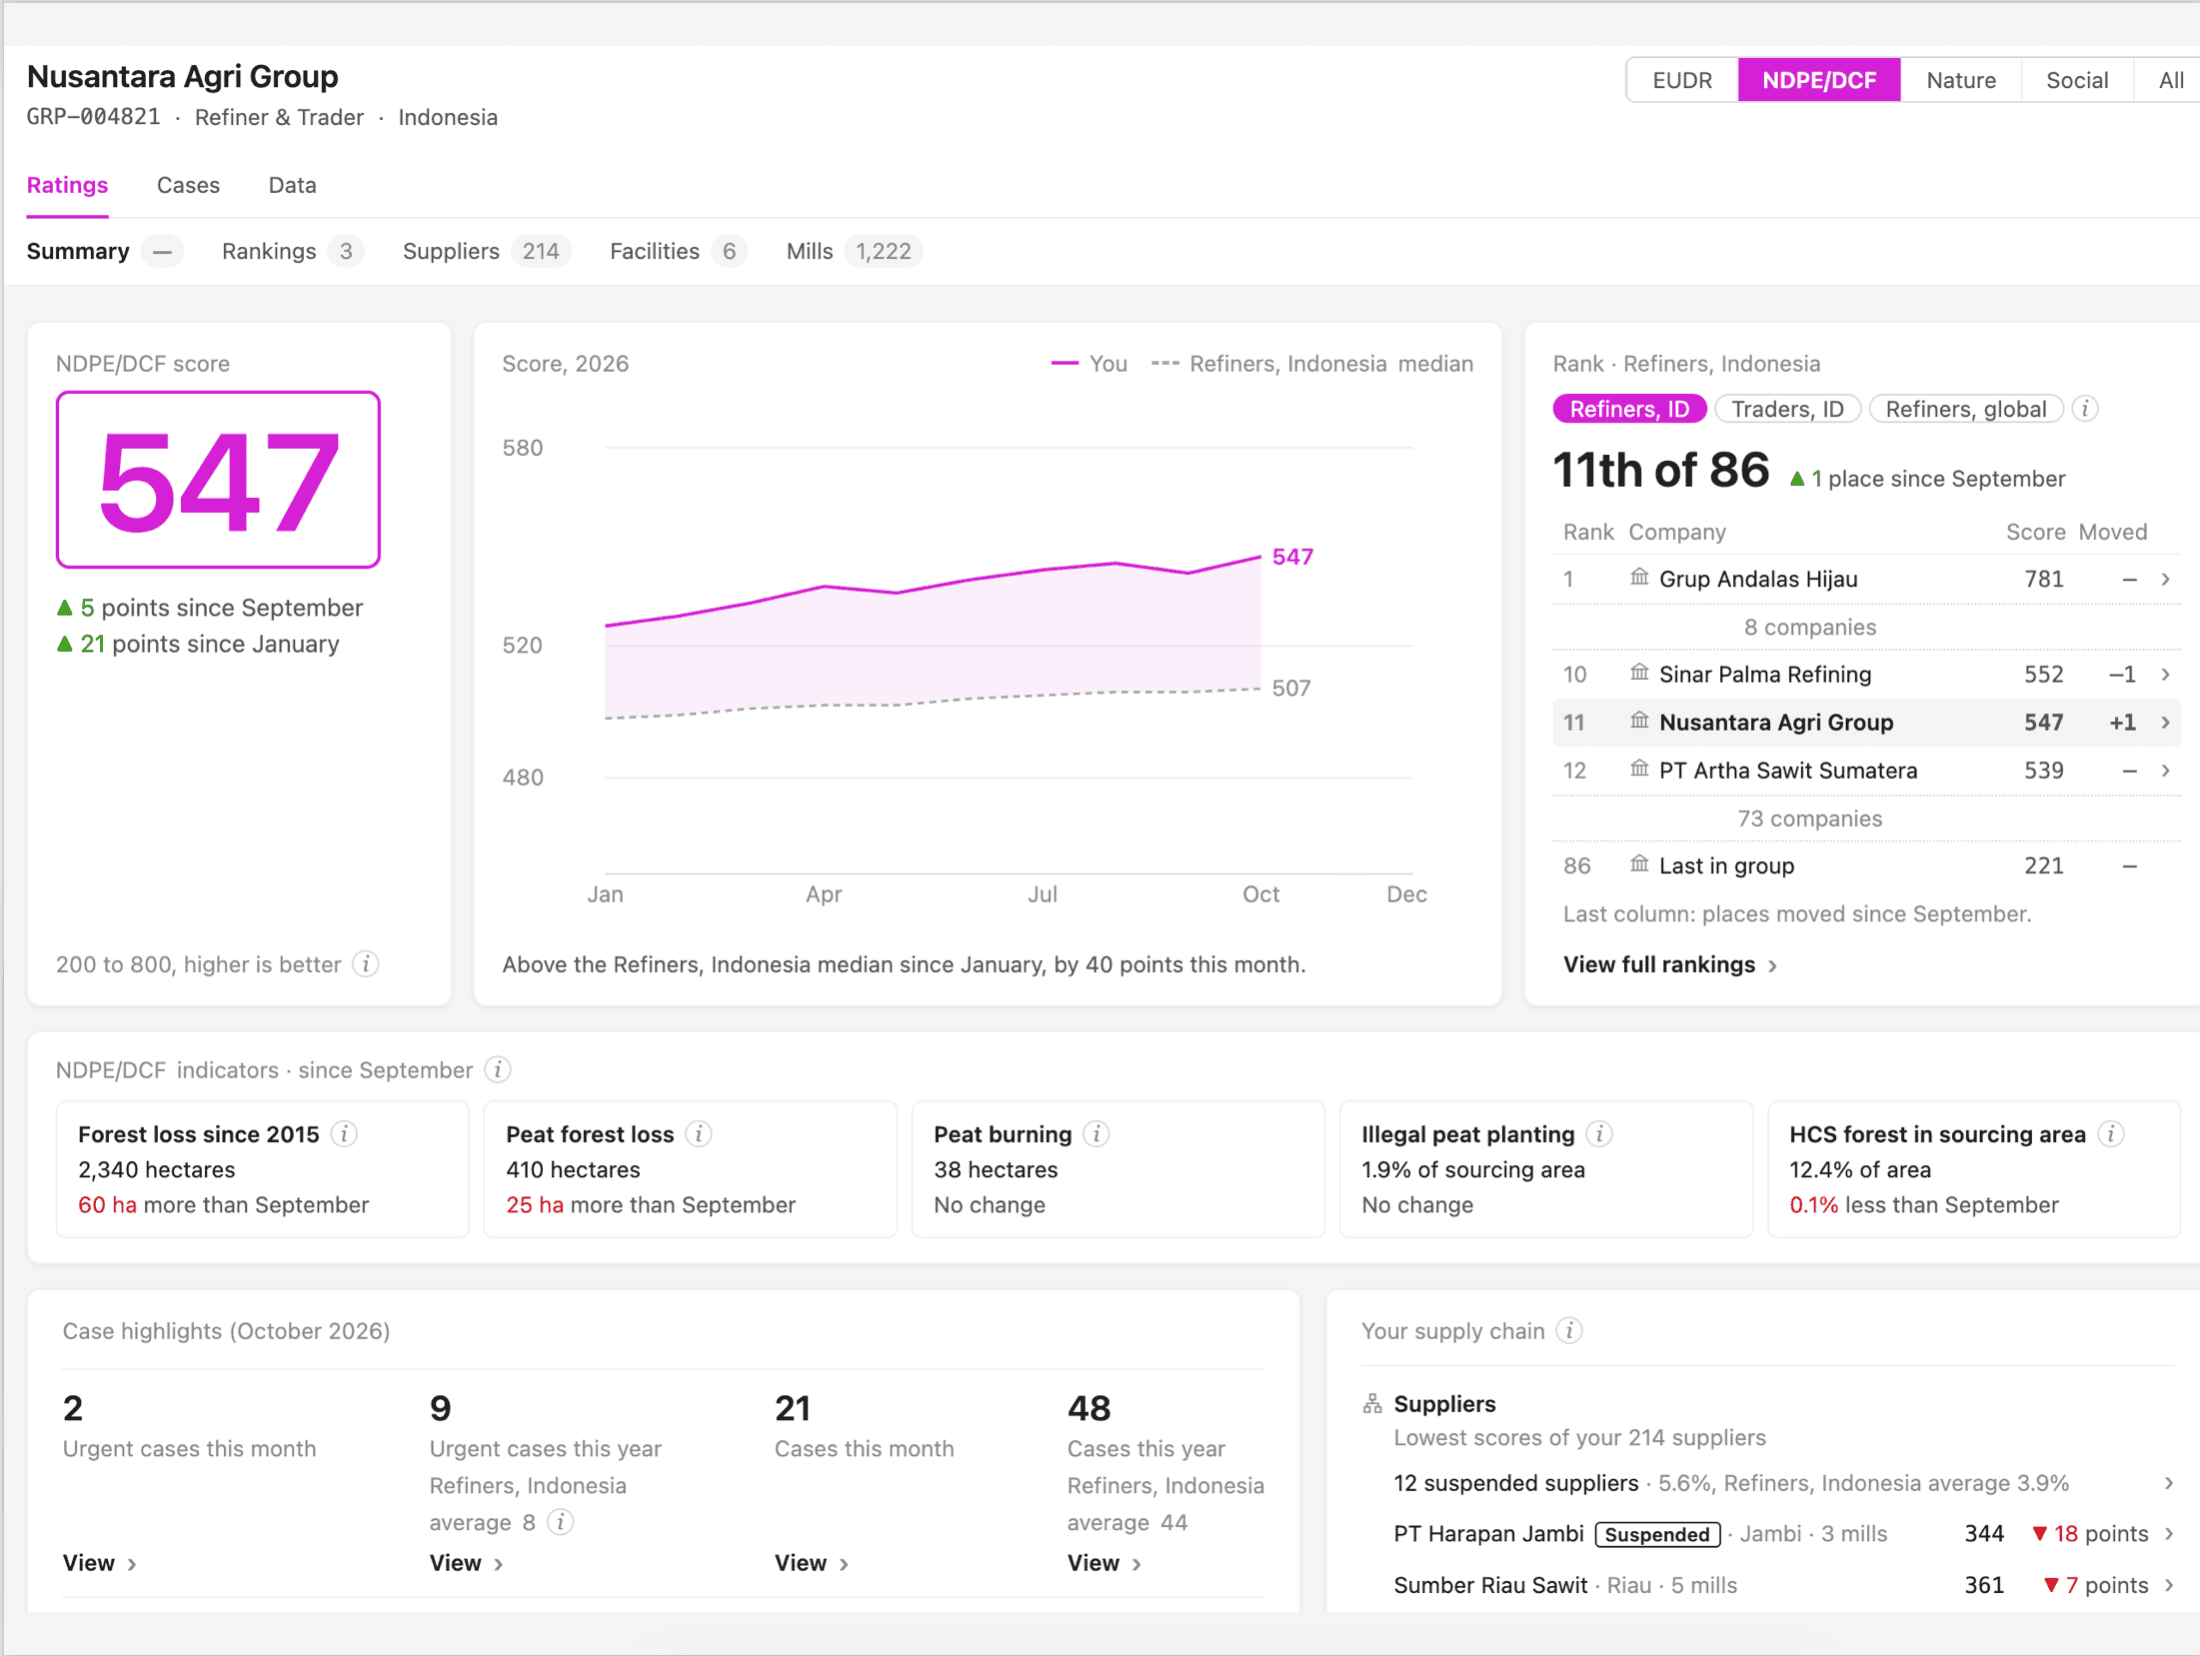
See your NDPE/DCF risk rated and ranked by supplier
Your NDPE/DCF dashboard compares your performance to your peers and ranks your suppliers by NDPE/DCF deforestation, peat loss and exploitation from the plot and mill level.
Dashboards are not public. They are only visible to subscribers.
The problem
NDPE and DCF methodologies lack a common standard, which makes peer comparison difficult and slow
Traceability data is private. NDPE/DCF assessment is often based on plot data customers never see, so they cannot independently evaluate a supplier's score.
Self-reported questionnaires do not show performance. A questionnaire takes weeks to complete and measures policy rather than progress.
Apples to oranges comparison. Companies committed to NDPE cannot measure themselves against their peers because each assessment uses a different method.
Assessment is annual. Most are performed annually, so you cannot track progress throughout the year.
The solution
NDPE/DCF Risk Ratings provide a common standard to assess your progress against your peers every month
Monthly supplier and mill ratings
Your suppliers and mills rated each month for deforestation, peat clearance and exploitation risk, using forest alerts, expert-reviewed deforestation reports, grievances and news reports.
Learn moreMonthly NDPE/DCF cases
Every month, NDPE/DCF cases are identified and linked to your supply chain. The cases are rated for severity, so you can decide which need your attention first.
Learn morePeer ranking
Your position against companies of comparable size and focus, tracked month to month so progress is visible.
Learn more
Calculating your DCF percentage or reporting against the NDPE IRF? Plot CheckPortfolioRisk InsightsHelp desk
How it works
NDPE and DCF risk measures and compares company performance based on likely supplying plots and smallholder areas
Measure forest and peat loss
Deforestation is calculated after the 2015 cut-off. Forest loss on peat is quantified each year and flagged monthly, along with planting on protection-function or deep peat in Indonesia.
- Estimated supplying plotsindustrial
- Smallholder areasseparated
Calculate across supplying plots
Each indicator is calculated across the plots estimated to supply each mill and the wider 50km sourcing area, so smallholder clearance is separated from industrial clearance rather than dropped.
- Labor rights
- Land conflict
- Community dispute
- Wages
Identify exploitation risk
Grievances and news reports linked to supplying plots and mills identify exploitation risk, such as labor rights violations and land conflict.
Roll up and rank against peers
Results roll up to facilities and companies through published mill lists, and each company is ranked against comparable peers.
No published mill list? You can securely upload a private mill list to see NDPE/DCF ratings for your supply chain, suppliers, mills and facilities, and identify cases for engagement. Your rating is only visible to you and your team. It does not affect subscriber-facing ratings.
Benefits
What changes for you
Comparable NDPE/DCF scores. Every company is measured with the same methodology and compared to its peers, so the score reflects performance.
Track progress monthly. Most NDPE/DCF methods are annual assessments that tell you where you were. Ratings update monthly to tell you where you are, and monthly email notifications alert you to changes and urgent cases.
Buyer assurance. Because ratings are performance based, your customers can see how you rate compared to your competitors and reward your mitigation investments.
No questionnaire or plot disclosure. Ratings are based on your published or uploaded mill lists, not lengthy questionnaires with opaque scoring systems or private plot data.
Who it's for
NDPE/DCF efforts made upstream are visible downstream
Refiners and producers
Find and address high risk suppliers to your facilities and prove to your customers how your facilities compare with comparable refiners.
Learn moreTraders and processors
Rank and compare all of your suppliers and supplying facilities by the same NDPE/DCF risk score.
Learn moreOleochemical and ingredient manufacturers
Show your customers a defensible NDPE/DCF rating without filling in a questionnaire.
Learn moreFMCG and brands
Risk cases help you prioritize which suppliers to engage with first and provide the evidence to ensure you get a response.
Learn more
Independence
The same five principles apply to every rating.
Get started today
Invest in nature conservation and restoration initiatives with confidence.
Get free early accessFree early access for companies that produce, buy, trade, or invest in palm oil and derivatives.